2026-02-14
how-to-analyze-interview-data
You've just wrapped up a series of insightful interviews. The conversations were rich, the participants were candid, and you’re sitting on a goldmine of qualitative data. Now what? Staring at a folder full of audio files can feel intimidating, but turning those raw conversations into clear, actionable insights is a well-defined process.
It’s all about systematically moving from spoken words to powerful conclusions. This journey involves transcribing the audio, coding the text to spot recurring ideas, and then clustering those codes into broader themes that tell a story.
Your Roadmap From Raw Audio to Rich Insights
Let's be honest, many projects stall right here. You have hours of great conversation, but without a clear workflow, it's easy to get lost in the details. The key is to follow a structured path that takes you from messy transcripts to a polished, insightful report.
This guide is your step-by-step plan for navigating the entire analysis process. We'll break down each stage so you know exactly what to do.
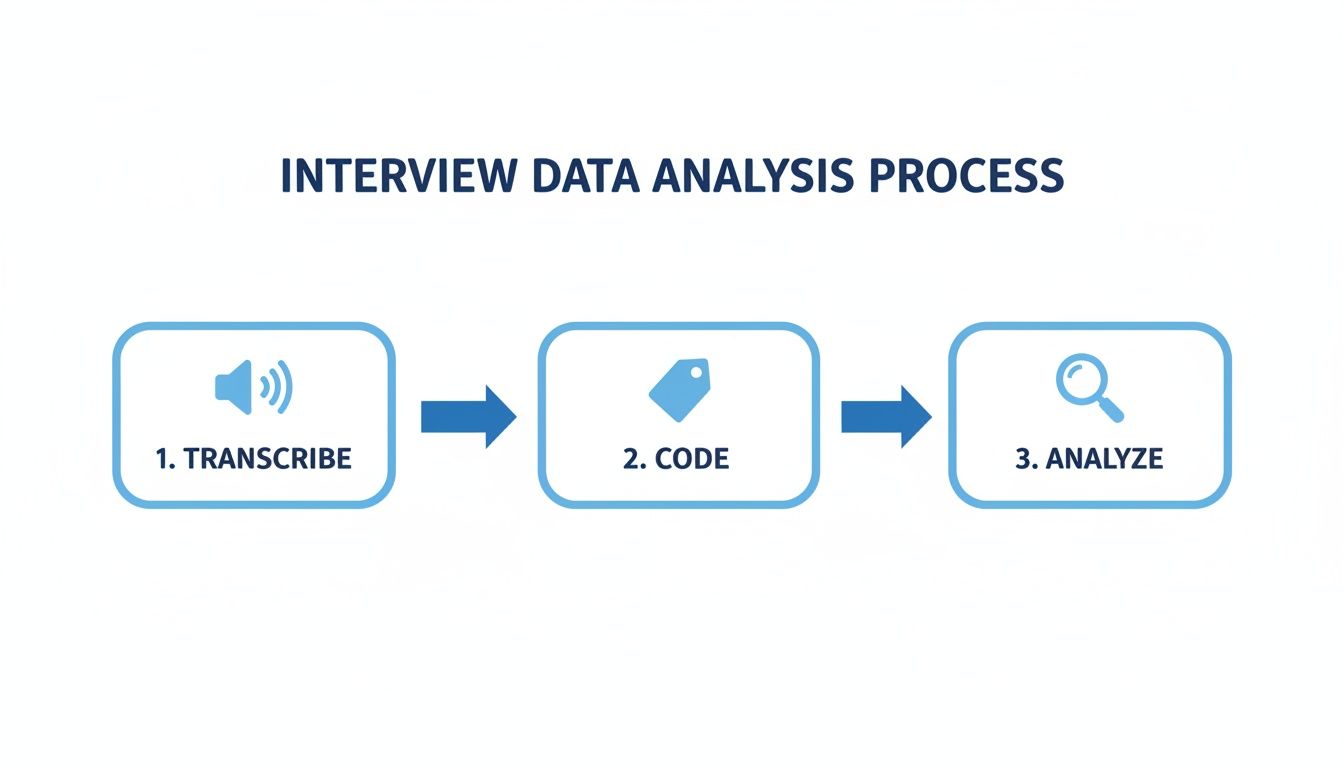
Think of it as a three-part journey: Transcribe, Code, and Analyze.
Before we dig into the nitty-gritty of each step, this table gives you a bird's-eye view of the entire workflow. It’s a handy mental map to keep in mind as we go deeper.
Core Stages of Interview Data Analysis
| Stage | Primary Goal | Key Activities |
|---|---|---|
| Preparation | Set the foundation for analysis. | Create accurate, clean, and anonymized transcripts. |
| Exploration | Familiarize yourself with the data. | Read through transcripts, make initial notes, and identify early patterns. |
| Coding | Systematically categorize the data. | Assign labels (codes) to specific quotes, ideas, or concepts in the text. |
| Theming | Synthesize codes into broader concepts. | Group related codes together to form overarching themes or categories. |
| Reporting | Communicate your findings. | Structure themes into a narrative, supported by quotes and data visualization. |
Each part of this process builds directly on the one before it, making sure your final conclusions are directly and transparently tied back to what your participants actually said.
How Modern Tools Have Changed the Game
This kind of analysis isn't just for academic research anymore; it's a critical skill in many fields. Take hiring, for example. With employers receiving an average of 180 applicants per hire, HR teams use structured interview analysis to find the best candidates efficiently.
This pressure has fueled a tech boom, with 72% of companies now using tools for things like video interview analytics to streamline their process.
The real magic happens when you move from individual comments to overarching themes. A single powerful quote is interesting, but a pattern supported by multiple participants is a finding you can build on.
Modern tools have especially transformed the first, and often most tedious, step: transcription. AI-powered services have made converting audio to text faster and more accurate than ever. Kopia.ai's , for example, can turn hours of recordings into a clean transcript in minutes. Nailing this first step sets you up for a much smoother and more effective analysis.
Getting Your Interview Data Ready for Analysis
Before you can start digging for those game-changing insights, you need to lay the groundwork. The quality of your data prep directly impacts the quality of your analysis—it's that simple. This part of the process isn't the most exciting, I'll admit, but getting it right now will save you a world of pain later.
Think of this phase as having two critical milestones: one ethical, one practical. Both are non-negotiable.
First Things First: Protect Your Participants with Anonymization
Your absolute first move should be to protect the identity of the people you interviewed. This isn't just good practice; it's an ethical requirement for any credible research. Anonymization means methodically stripping out or changing any personally identifiable information (PII) from your transcripts.
And it’s more than just swapping out names. You have to develop a sharp eye for the little details that could give someone away.
- Direct Identifiers: This is the obvious stuff. Swap out names of people, companies, or specific cities with generic placeholders like "[Participant 1]," "[Company X]," or "[City A]."
- Indirect Identifiers: This is where it gets tricky. Look for unique job titles, specific project names, or personal stories so distinct they could point back to the speaker.
- Keep a Consistent System: I always create a separate, secure document that acts as a key, linking pseudonyms back to the original participant (e.g., Jane Doe = Participant 1). This is for your eyes only and should never, ever be shared.
Nailing this step builds trust and keeps your work ethically sound.
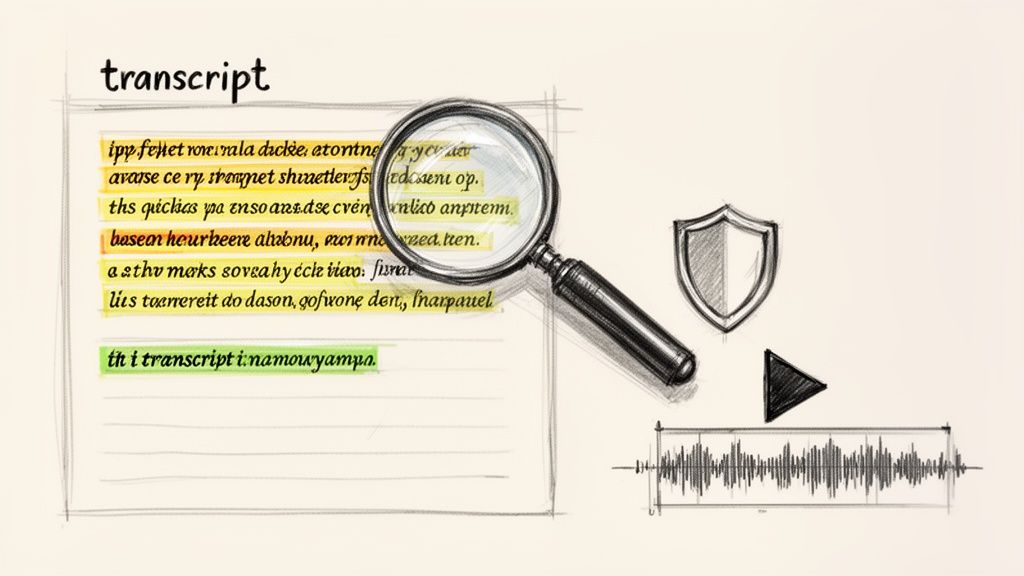
The Make-or-Break Step: Transcription
With your ethical duties handled, it's time to tackle transcription—turning all that spoken audio into clean, written text. Your transcript is the bedrock of your entire analysis. A single transcription error can twist the meaning of a quote and send your findings in the wrong direction.
Not too long ago, this was an agonizingly manual job. I remember spending four to six hours transcribing just one hour of audio. Now, you have a choice: go old-school with manual transcription or embrace modern automated tools.
Key Takeaway: Your transcript isn't just a document; it's your primary dataset. The more accurate and well-formatted it is, the more reliable and insightful your analysis will be.
Doing it by hand gives you total control and forces you to get intimately familiar with your data. But the time commitment is massive and can easily derail your project timeline.
This is where AI-powered transcription services have completely changed the game. A tool like can generate a surprisingly accurate transcript in minutes, freeing you up to focus on the actual thinking and analysis.
The real magic of a modern tool is how it syncs the text directly to the audio. Being able to click any word and instantly hear it spoken is a huge advantage for verifying accuracy. This feature alone makes these tools a must-have for anyone doing serious interview analysis.
Formatting Your Transcripts for Smooth Sailing
Once you have the text, a little bit of formatting makes a world of difference. A clean, consistent document makes the next phase—coding—so much easier. For a deeper look at the nitty-gritty, you can check out our guide on .
Here are a few best practices I always follow:
- Standardize Speaker Labels: Keep it consistent. Use something like "Interviewer:" and "Participant 1:" or simple initials like "INT:" and "P1:". Making them bold helps them pop.
- Add Timestamps: Including timestamps at key moments or at the start of each person’s turn is a lifesaver. It lets you jump right back to the audio to catch the tone or clarify a confusing phrase.
- Note the Non-Verbals: Don't forget the cues that words alone miss. I use brackets to jot down things like [laughs], [long pause], or [sighs]. This stuff is pure gold for understanding sentiment.
- Use Clean Paragraph Breaks: Every time the speaker changes, start a new paragraph. It’s a simple trick that massively improves readability and makes pulling quotes a breeze.
By taking the time to properly anonymize, transcribe, and format, you’re creating a clean, reliable dataset. This careful prep work is what sets you up for a truly rigorous and insightful analysis.
Choosing Your Analytical Approach
With your transcripts clean and ready, you’re at a critical decision point. You need to pick an analytical strategy, and the path you choose will shape everything that follows. Think of it less like a rigid formula and more like selecting the right lens to bring your data into focus.
The best approach depends entirely on your research goals. Are you trying to understand shared experiences, count specific mentions, or build a new theory from scratch? Let's break down three of the most common methods to help you decide.
Thematic Analysis: Finding the Patterns
If you’re new to qualitative analysis, thematic analysis is often the best place to start. It’s flexible, straightforward, and incredibly powerful for finding patterns—or themes—across your interviews. Instead of just counting words, your goal is to understand the underlying meanings and shared experiences woven into the participants' stories.
Imagine you just interviewed ten customers about their onboarding experience with your new software. Reading through the transcripts, you might start highlighting recurring ideas like "confusing initial setup" or "helpful video tutorials." Thematic analysis helps you group these smaller ideas into broader, more meaningful themes, like "Initial User Frustration" or "Value of Visual Guides."
This method is perfect for answering the "how" and "why" questions that get to the heart of people's experiences, making it a favorite for researchers across many fields. If you're looking for rich, detailed insights, this is your go-to.
Content Analysis: Measuring the Mentions
Where thematic analysis seeks meaning, content analysis brings a more quantitative edge to your qualitative data. It’s all about systematically identifying and counting the presence of specific words, phrases, or concepts. This approach is ideal when you need to answer "how often?"
Let's say you just launched a new feature and want to gauge reactions. You could use content analysis to comb through interview transcripts and count every mention of "easy to use," "buggy," or "time-saving." This turns subjective feedback into measurable data points, which can be incredibly useful for tracking trends or reporting to stakeholders who love hard numbers.
This often leads to a mixed-methods approach. For instance, you could use descriptive stats to find the average number of times a key concept like "leadership" was mentioned per interview. With research showing that an average of 180 applicants apply for a single job and 72% of firms now use AI for screening, being able to categorize and quantify qualitative feedback is more important than ever.
Grounded Theory: Building From the Ground Up
Grounded theory is the most exploratory of the three. You don't start with a hypothesis or a set of preconceived ideas. Instead, the goal is to develop a completely new theory that is "grounded" in the data itself. You let the stories and experiences of your participants guide you toward a fresh perspective.
This is the method to choose when you're venturing into uncharted territory—studying a topic where little is known or existing theories don't quite fit. For example, a researcher exploring the coping mechanisms of gig economy workers might use grounded theory to build a brand-new model explaining how they navigate financial instability, based entirely on what the workers described in their own words.
Pro Tip: Let your research question be your guide. If you’re exploring experiences, thematic analysis is a great fit. If you need to measure frequency, go with content analysis. And if you’re aiming to generate a new theory, grounded theory is your path.
Comparing Qualitative Analysis Methods
Choosing the right approach can feel daunting, so I've put together a quick comparison table. Use this to see which method best aligns with your research project and what you hope to achieve.
| Method | Best For | Primary Outcome | Example Use Case |
|---|---|---|---|
| Thematic Analysis | Understanding shared experiences and perceptions. | A rich description of common themes across the data. | Mapping the customer journey from user interviews. |
| Content Analysis | Quantifying the frequency of specific words or ideas. | A summary of how often key concepts appear. | Tracking mentions of a new product feature in feedback. |
| Grounded Theory | Developing new theories from the data itself. | A new conceptual model or framework. | Explaining a social process where no theory exists. |
Ultimately, taking the time to select the right analytical approach gives you a clear plan of action. It provides the structure you need to confidently move from a folder full of transcripts to a set of compelling, well-supported findings that directly answer your research questions.
Coding Transcripts and Developing Themes
This is where the real detective work begins. Your transcripts are ready, you’ve picked an analytical approach, and now it's time to roll up your sleeves. We’re moving into the coding phase—the hands-on process of labeling and organizing your text to find the patterns hidden inside.
Think of coding as a way to systematically break down your interviews into their essential parts. Once you have these building blocks, you can piece them back together into a structure of powerful themes that answer your research questions.
The Two Paths of Coding: Inductive and Deductive
Before you even think about applying your first label, you need to decide on your coding philosophy. Are you going to let the codes surface naturally from the data, or will you start with a list of what you're looking for? This choice sets the tone for your entire analysis.
Deductive Coding (Top-Down)
Let's say you're a product manager looking at interviews about a new software feature. You probably already have a few key areas you want to explore: Ease of Use, Performance Bugs, and Feature Requests. That’s deductive coding in a nutshell.
You begin with a predefined set of codes, usually based on your research questions or an existing theory. As you read, you simply tag the text with these codes. It’s a very structured and efficient way to work, especially when you're testing a specific hypothesis.
Inductive Coding (Bottom-Up)
Inductive coding is the complete opposite—it’s pure exploration. You start with no preconceived notions and let the codes emerge directly from what your participants are saying. This is the heart of methods like thematic analysis and grounded theory.
For example, while reading that same software feedback, you might see several users mention how the feature saves them time on a specific task. You could create a new code on the spot, like "Workflow Efficiency." This idea wasn't on your radar, but it came straight from the data itself.
Key Takeaway: You don't have to choose just one. Many researchers use a hybrid approach. They might start with a few deductive codes but stay open to adding inductive ones as new ideas pop up. The most important thing is to be intentional about your strategy.
The Mechanics of Applying Codes Line by Line
Coding is really just a process of deep, focused reading. Whether you're using specialized software like , a simple spreadsheet, or colored highlighters on paper, the core activity is the same. You go through each line, and when you find a significant piece of information—an idea, an emotion, an experience—you assign it a code.
A code is just a short, descriptive label. If a participant says, "I was so frustrated because I couldn't find the save button," you might apply a few codes:
User FrustrationUI Navigation ChallengeSave Function Issue
Don't hold back on creating codes during this first pass. The goal is to capture every single idea that might be relevant. You can always clean them up and combine them later.
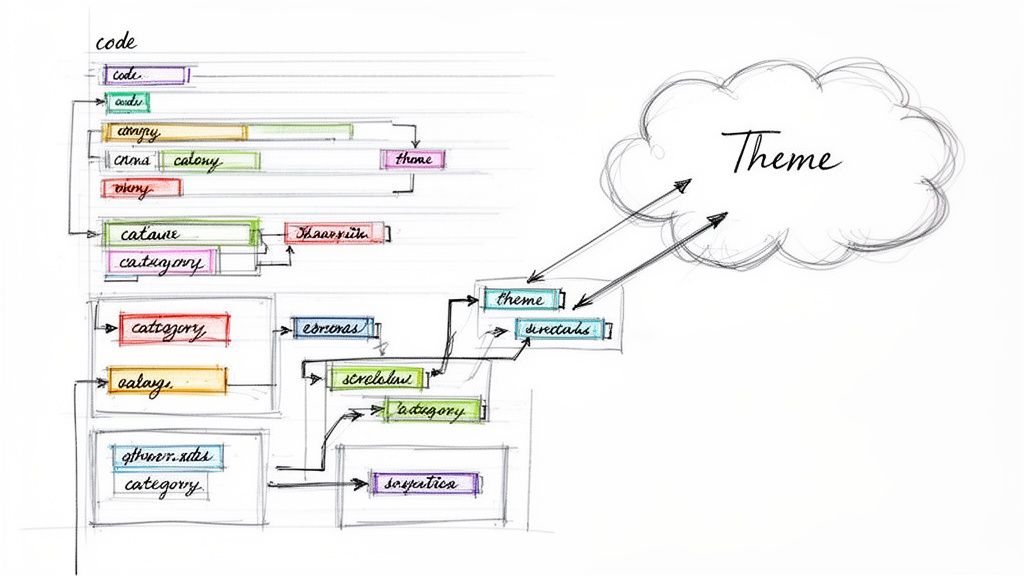
From Messy Codes to Meaningful Categories
After you’ve gone through your transcripts, you'll probably be looking at a long, messy list of codes. That’s a good sign! Your next move is to bring some order to the chaos by grouping related codes into broader categories.
It’s a bit like organizing your kitchen pantry. You don't keep every single can of tomatoes separate. Instead, you group "canned tomatoes," "pasta sauce," and "sun-dried tomatoes" into a bigger category called "Tomato Products."
Here's how that might look with data from a study on remote work:
| Initial Codes | Potential Category |
|---|---|
Feeling isolated | Challenges of Social Connection |
Missing office banter | |
Difficulty collaborating spontaneously | |
Enjoying flexible hours | Benefits of Autonomy |
Ability to run errands midday | |
No commute stress |
This isn’t just sorting for the sake of it. When you group codes, you’re actively interpreting the data and starting to see the bigger picture emerge.
Distilling Your Findings Into Powerful Themes
The final and most important step is to distill your categories into overarching themes. A theme is much more than a summary; it's the central, unifying idea that helps answer your research question. It tells a compelling story about your data.
While a category like "Challenges of Social Connection" is descriptive, a theme takes it further. A powerful theme based on that category might be: "Remote work creates a profound sense of professional isolation that digital tools alone cannot solve."
See the difference? The theme makes a strong claim and captures a significant, recurring idea from across your interviews. Every theme you develop should be backed up by a solid foundation of quotes and codes from your data.
Pro Tips for a Smoother Coding Process
Coding can feel like a marathon, but a few good habits can make the process much more manageable.
- Keep a Codebook: This is just a simple document where you list each code, its definition, and a clear example. A codebook is crucial for staying consistent, especially if you’re working in a team.
- Write Memos: As you code, keep a separate document open for your thoughts. Jot down questions, hunches, and connections you're seeing. These notes are gold when it's time to build your themes.
- Use Modern Tools to Your Advantage: While you can absolutely code manually, AI tools can give you a major head start. Platforms like do more than just provide accurate transcripts; their features can automatically suggest topics or summarize content, helping you spot potential codes much faster.
Making Sure Your Findings Are Solid (And Convincing)
So, you’ve spent hours coding, sifting, and sorting, and you’ve finally landed on a set of core themes. That’s a huge milestone. But the work isn't quite done. The real question is: are these findings trustworthy? And just as important, how do you get your stakeholders, clients, or team to believe in them?
This is where you shift gears. You've been the detective, meticulously piecing together the clues. Now, it’s time to be the storyteller, building a rock-solid case that’s not just accurate, but genuinely persuasive. Great analysis is useless if no one trusts it.
How to Build Credibility and Check Your Work
Before you even think about writing a report, you need to pressure-test your own conclusions. This isn’t about doubting yourself; it’s about making your work bulletproof. I always fall back on two tried-and-true methods: inter-coder reliability and triangulation.
Think of inter-coder reliability as a "sanity check" with a colleague. Grab a small portion of your data—maybe 10-20% of your transcripts—and have someone else code it using the codebook you developed. Then, you sit down and compare your results. You're not looking for a perfect 100% match, but a high degree of overlap shows that your codes are clear and logical, not just a reflection of your own personal interpretation. It proves the system works.
Triangulation is a bit different. It’s all about looking for corroborating evidence from other places. Ask yourself:
- Do the themes I found in the interviews match what I saw in my field notes?
- Are these sentiments echoed in the results of that survey we ran last quarter?
- Does this line up with what other researchers have published on the topic?
When you can show that multiple, independent sources all point to the same conclusion, you build a much stronger, more defensible argument. You’re showing that your themes are part of a real, verifiable pattern.
Turning Your Themes Into a Compelling Story
With your themes validated, you can now focus on the narrative. A simple bulleted list of findings is dry and easy to forget. A story, on the other hand, resonates. Your goal is to guide the reader from the problem you started with to the powerful insights you uncovered.
Start by outlining how you'll present your themes. I often find it works best to lead with the most significant, overarching theme and then drill down into the more specific ones. Give each theme its own dedicated section in your report. Here, you'll introduce the idea, explain why it matters, and—this is the most critical part—back it up with powerful evidence from your interviews.
Your job isn’t just to present data; it’s to make your reader feel the weight of your participants' experiences. Quotes are the single most powerful tool you have to achieve this.
Never underestimate the power of a good quote. A direct quote can take an abstract theme like "User Onboarding Challenges" and turn it into a vivid, relatable human story. Be selective. Pick quotes that perfectly capture the essence of a theme while also being clear and impactful.
Getting Creative with Your Presentation
Even the way you structure your interviews can become a source of insight. For example, you can borrow A/B testing from the quantitative world. By trying out two different interview scripts, you can see how slight changes in phrasing affect the answers you get. Be careful, though—data science benchmarks show that simple mistakes like a sample mismatch can skew results by up to 50%.
This is one area where newer tools can really help. By auto-transcribing your A/B sessions with a tool like , you can use its "talk to transcript" features to spot key topics 30% faster. The platform can even create chapters automatically, revealing that 62% of insights often come from these clearly defined dialogue sections. If you're interested in digging deeper into this, exploring can provide more context.
In the end, your final report is the culmination of all your hard work. By making sure your findings are solid and weaving them into a compelling narrative backed by vivid evidence, you elevate your analysis from a simple exercise into a truly persuasive and influential piece of work.
A Few Common Questions About Analyzing Interview Data
Even with a solid plan, you're bound to run into questions once you're deep in the data. Let's walk through some of the most common hurdles researchers hit. Getting clear on these points early can save you a ton of time and make you more confident in your final analysis.
What’s the Best Software for Analyzing Interview Data?
Honestly, there's no single "best" tool. The right choice really comes down to the size and complexity of your project. The one non-negotiable is starting with a great transcript, so a reliable AI transcription service is your first and most important investment.
Once you have that clean transcript, you have a few paths for the actual coding and analysis:
- Spreadsheets (Excel, Google Sheets): Don't underestimate them! For smaller projects, a simple spreadsheet is often all you need. They're free, accessible, and do a surprisingly good job of organizing codes and quotes.
- Qualitative Data Analysis Software (QDAS): Tools like or are the heavy hitters. They’re built from the ground up to handle massive datasets, intricate coding structures, and collaborative team projects.
For many researchers, a hybrid approach works wonders: use a top-notch transcription tool to get the text right, then manage the coding in a straightforward spreadsheet. It’s a fantastic balance of power and simplicity.
How Many Interviews Are Enough?
In qualitative work, we're not chasing a magic number. The real goal is to reach thematic saturation. This is that point in your research where new interviews just stop yielding new ideas or major themes. You'll find yourself hearing the same stories and concepts over and over.
For a very specific, narrow topic, you might hit saturation after just 5-10 really good interviews. If your study is broader or more complex, it could take 20 or more.
It’s always about the depth and richness of the data, not just the number of interviews. A dozen truly insightful conversations will always be more valuable than thirty shallow ones.
Focus on the quality of the information coming in. When your analysis feels complete and you haven’t uncovered a new major concept in the last few interviews, you're probably there.
What Should I Do with Conflicting Information Between Interviews?
When you find contradictory viewpoints, don't panic. This isn't a problem—it's an opportunity. It can be tempting to sweep these "negative cases" under the rug because they don't fit nicely into the themes you've already identified, but that’s a mistake.
Lean into the contradiction. Digging into why one person’s experience is so different from everyone else’s can lead to your most powerful insights.
Does this outlier highlight a unique subgroup you hadn't considered? An important edge case? A critical exception to a rule you thought was universal? Addressing these conflicts shows you’ve engaged with the full complexity of your data. It makes your final analysis stronger, more nuanced, and far more credible because you didn't just cherry-pick the evidence.
Can I Combine Qualitative and Quantitative Methods?
Absolutely. In fact, this is an incredibly powerful approach called mixed-methods analysis. It lets you get the best of both worlds: the rich, human stories from qualitative data and the statistical weight of quantitative data.
For instance, you could:
- Start with a thematic analysis to pull out the key themes and insights from your interview transcripts (that’s your qualitative part).
- Follow it up with a content analysis to actually count how many times those specific themes or keywords pop up across all your interviews (that’s the quantitative part).
This combination allows you to show not just what the key insights are, but also how prevalent they are, making for a much more compelling and comprehensive report.
Ready to turn your interview recordings into clean, searchable text? With Kopia.ai, you get fast, accurate transcripts in minutes, complete with speaker labels and synchronized audio. You can stop spending hours on manual transcription and jump right into what matters—your analysis. Check out and try it for yourself.